Which source, which step, which campaign paid.
One report from visit to paid order, by source, campaign or funnel. Each number says how it was counted.
From visit to customer, in one column.
Visitors, new leads, qualified leads, meetings logged, deals opened and won, new customers, net revenue and refunds for the period you choose. Contribution margin appears where you entered unit costs.
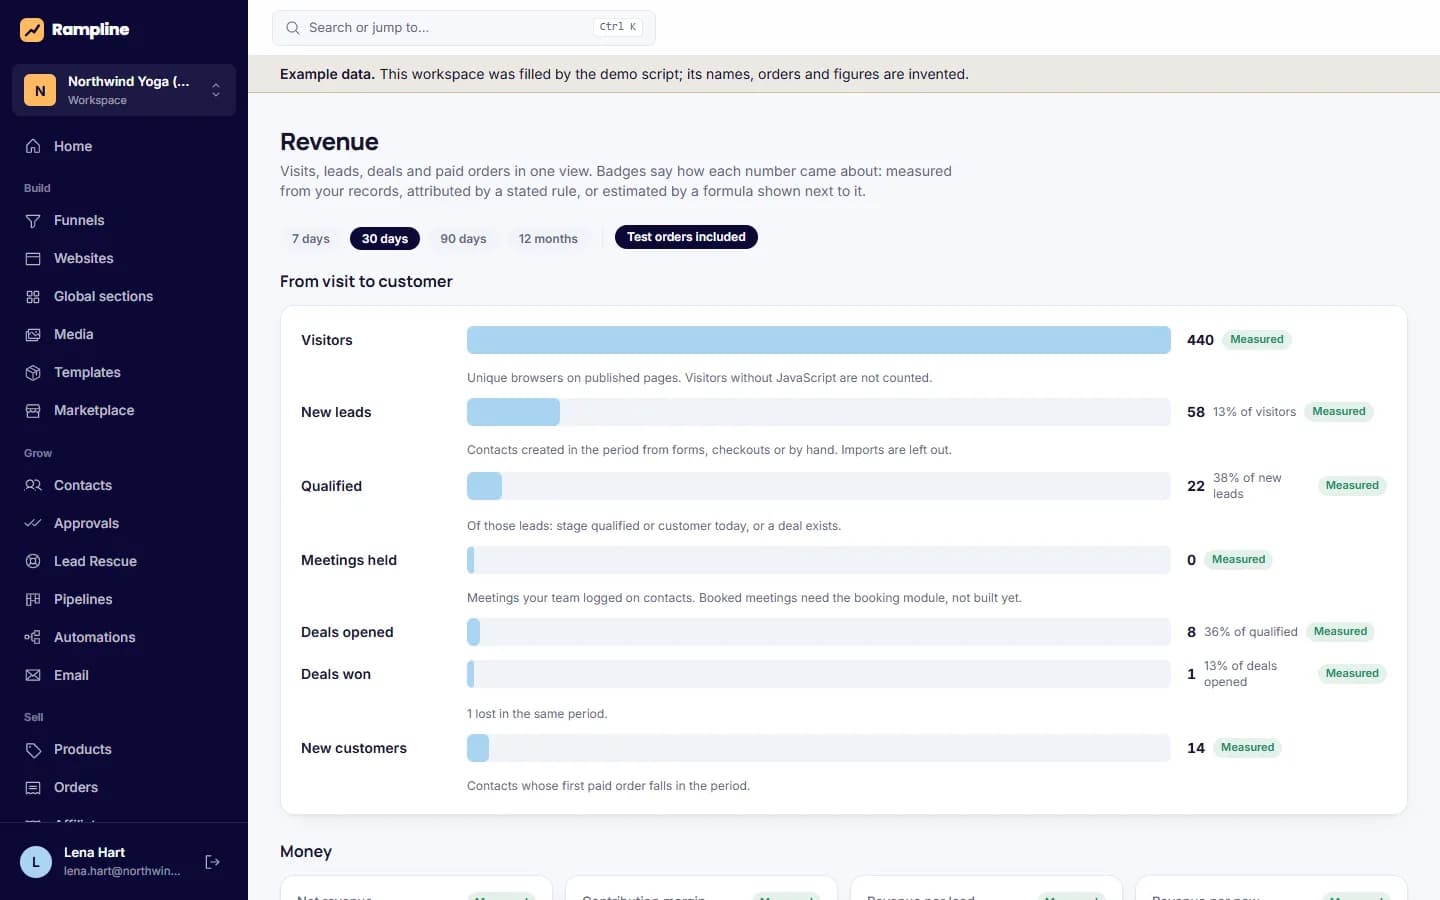
Three badges, no mystery numbers.
Measured comes from your records. Attributed follows a stated rule: first touch is the contact's first UTM, last touch is the UTM at checkout. Estimate shows its formula, as with lifetime value.
- Missing attribution shown as a share, with the reason
- Test orders left out unless you include them
- Totals per currency, never summed across currencies
Spend in, return out.
Enter what each source and campaign cost per month. The report returns cost per customer and return on spend next to the revenue those sources brought.
What it does not do yet
- Connections to Google Ads and Meta Ads: spend is entered by hand
- Booked meetings need the booking module, which is not built; logged meetings are counted
Related
- Conversion labA/B tests with sequential statistics, funnel diagnostics with evidence, personalization rules by source, device and language.
- Lead rescueUnassigned leads, missing first replies, overdue follow-ups, stalled deals and open checkouts, with notices, escalation and response times.
- Funnel builderFunnel map, block page editor, checkout with order bumps, one-click upsells, websites, blog and custom domains.
See it with example data, then build your own.
The demo opens a complete workspace: funnels, contacts, orders, a running A/B test. Nothing to install, nothing to sign.